
Ensuring accuracy and reliability through Audit, Error Checking, Stress Testing, and Sanity Checking is as crucial as the construction of the model itself. These processes are integral to validating the financial model's functionality, robustness, and accuracy, thereby safeguarding against misleading data interpretations and decisions. An audit provides a systematic review, ensuring that the model adheres to all Financial Modeling best practices in the industry. Error checking involves meticulous verification to catch and correct formulaic and reference errors. Stress testing evaluates the model’s performance under extreme conditions, while sanity checking ensures the model's outputs remain logical under various scenarios. Together, these methodologies fortify the model’s credibility, making them essential for anyone relying on financial models for strategic decision-making.
Audit
In the “Formulas” ribbon there is a section for Auditing the model that can be very useful. I’ll show some of the functions here.
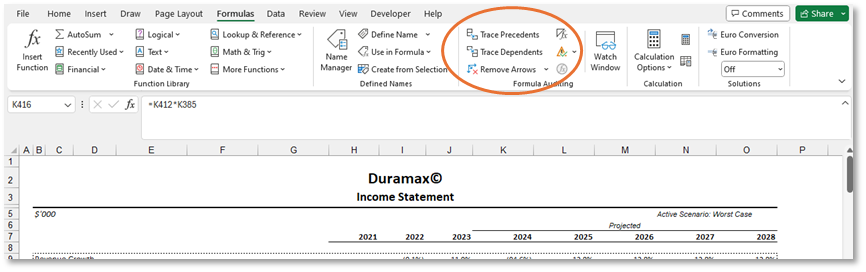
· Trace Precedents and Dependents
Use these buttons to understand your
calculations. Precedents –
where the items in the formulas come from, dependents – where the
formula is going to. Remove arrows
will clean everything.
·
Show formulas
This button will toggle between the results and the formulas in your model. It should be used to look for column consistency, value pasted around the model, etc. Tip: reduce the zoom so you have a general look in the model
· Look for white cells.
Another technique I use often is to look for white
cells. While you have already zoom out the model, select the whole model
(ctrl+A) and change the cells fill to grey.
That way, if there are any numbers with a white font hidden in the model
you will see them right away. There’s a
possibility that they are being used in calculations, changing the
results of formulas.
· Look for constants.
Hit F5 key and then Special. Choose Constants and uncheck text:
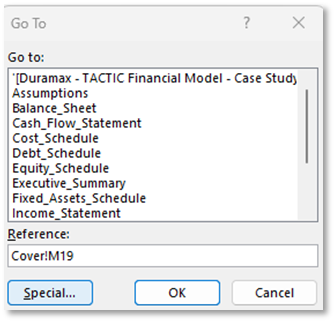
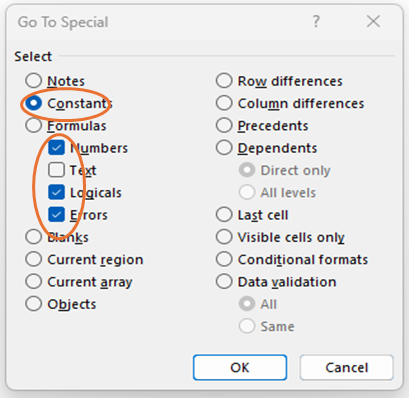
This will highlight all cells
that have hardcoded numbers on them.
Make sure all hardcoded should be hardcoded (i.e. historical figures or
assumptions) and they have blue font.
Error Checking
You can create several Error Checking in your model. It all will depend on the type of model and the type of error you see happening frequently and want to avoid. One frequent error that a lot of modelers face is to include a line and forget to change the total formula. To avoid that we can create a formula at the end of each total that will sum everything (including white spaces ) and subtract the totals, that we way we are basically summing just the lines, but including any line that would be later created in the middle. Make sure as you are doing this, think of the logic of the calculation ( for example, in the Income statement, we have the revenue and we subtract all items from it, consider that logic when you are building your error checks.
Move all the checks to a new tab and call it Error Checking. Make sure not to include this tab in printing.
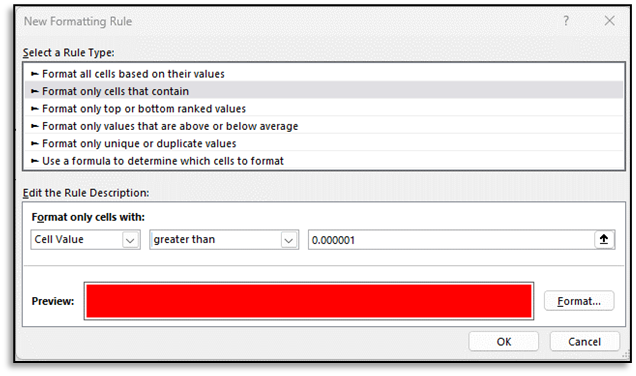
One extra step you can do is apply a conditional format to these cells. You can choose them to be green or red in case of errors or even choose an icon. To replace 0s and errors.

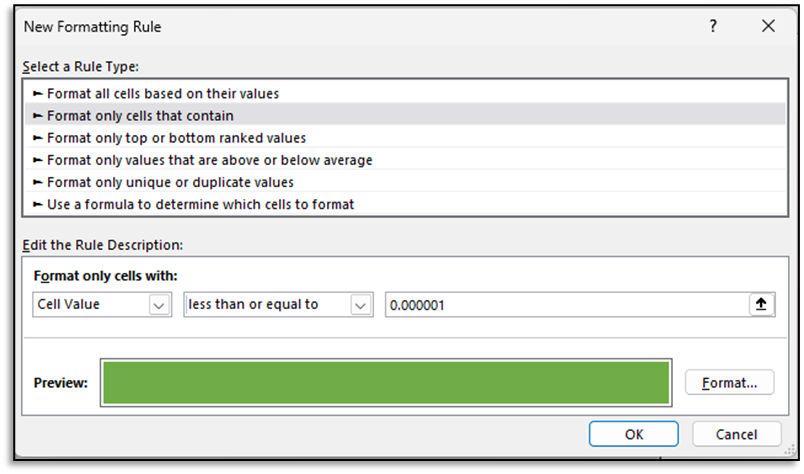
Click New Rule and Choose
“Format only cells that contain”. And
set your rule for values greater than 0.000001 (the number of decimal places
depends on your model. In this case, because
our model is in $’000, anything less than 0.000001 will mean less than a cent. Then Format your cells to show the fill and
font as red.
Do the same for anything less than or equal to. These are going to be green as they are error free.
Feel free to experiment with icons also.
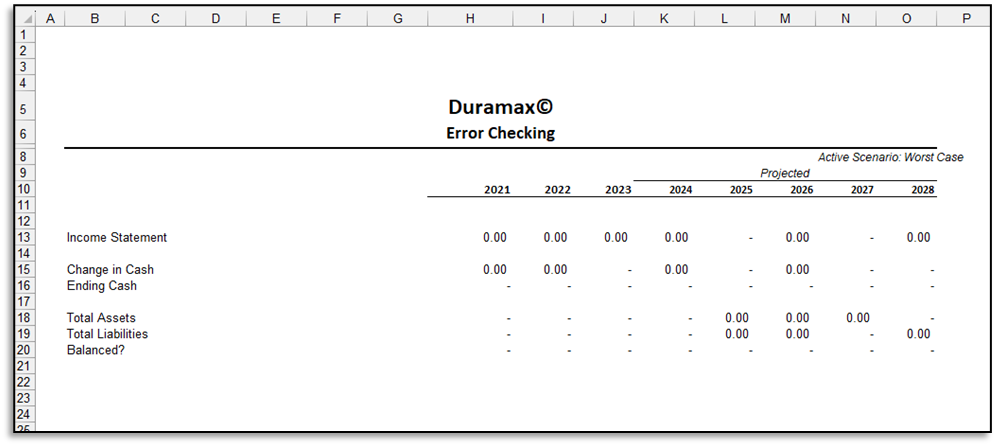
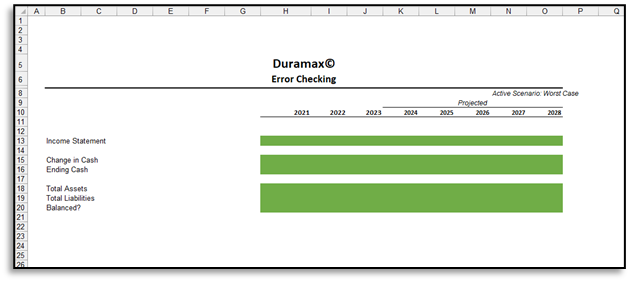
In case you are free of errors, your tab should look like this:
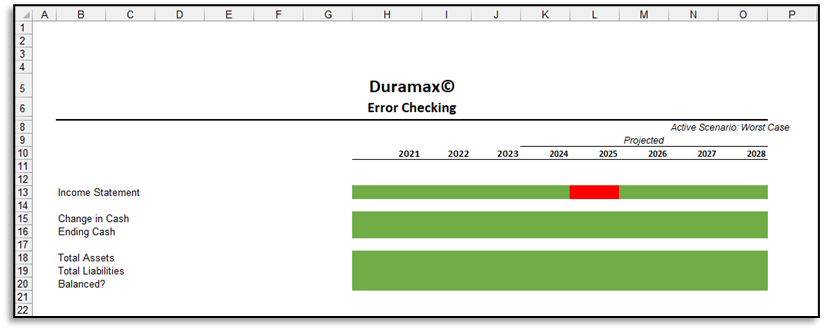
Make sure to test adding some errors on purpose, to ensure your error checking is working properly.
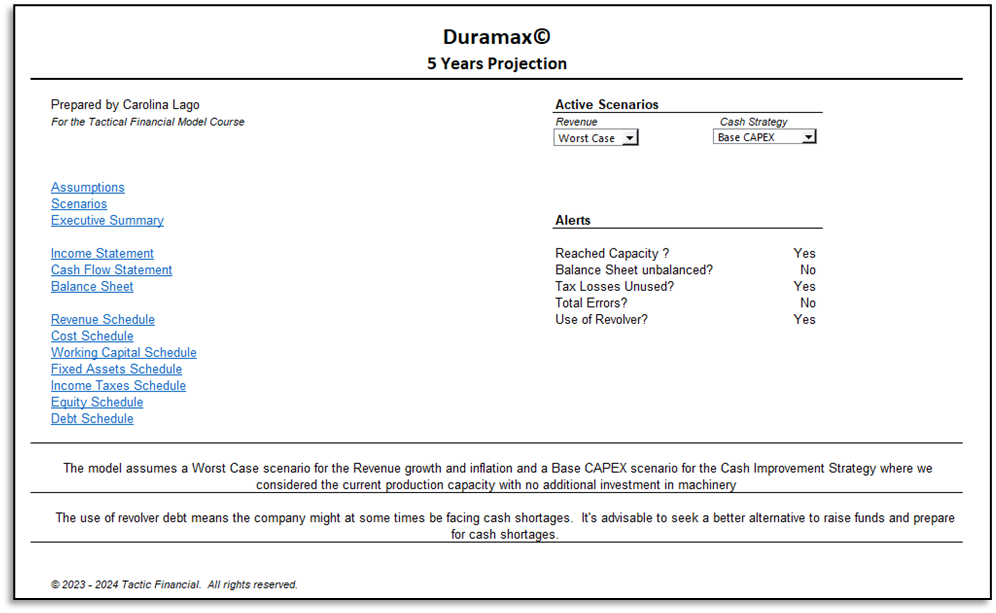
You can also add a little alerts box to your cover including a general alert for errors. Bear in mind that this is suitable for the audience you are presenting.
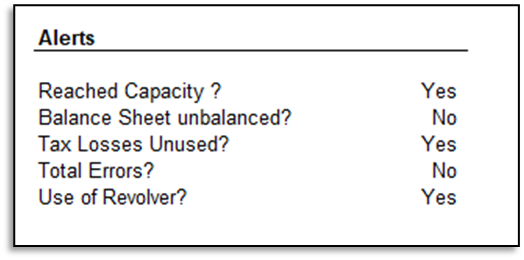
It’s also a good Idea to include dynamic notes to explain these alerts better in the cover. See how I did in the Duramax case for some inspiration:
Stress Testing
To stress test the model we will use extreme assumptions to make sure all our calculations work properly. This is something you could do as you are building the model. I’ll show some examples below:
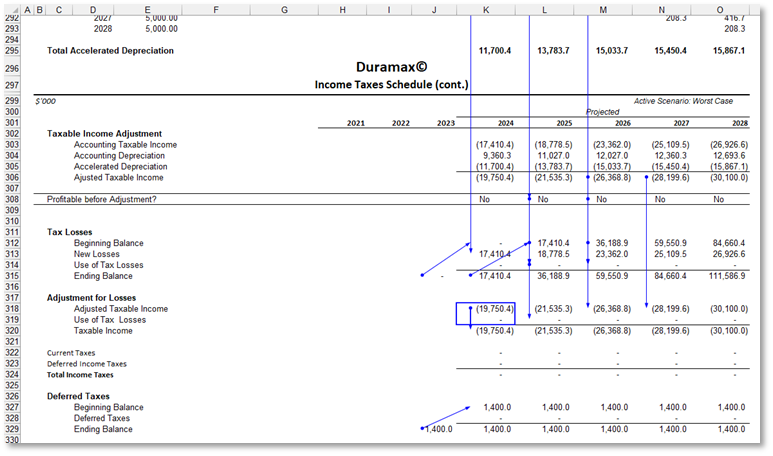
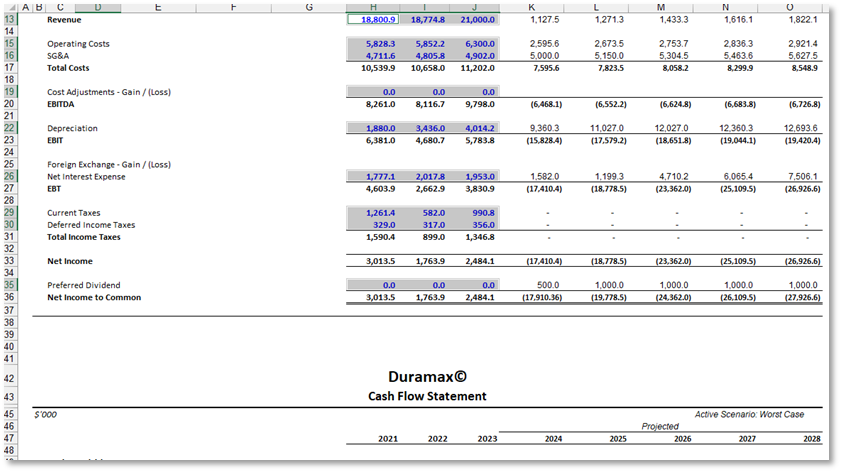
When we were calculating the tax schedule, we
noticed that we were not always profitable, therefore the taxes calculations
have a bunch of zeroes on it.
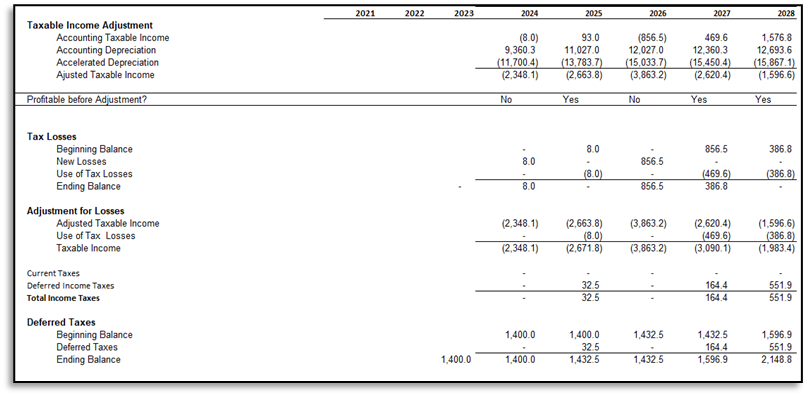
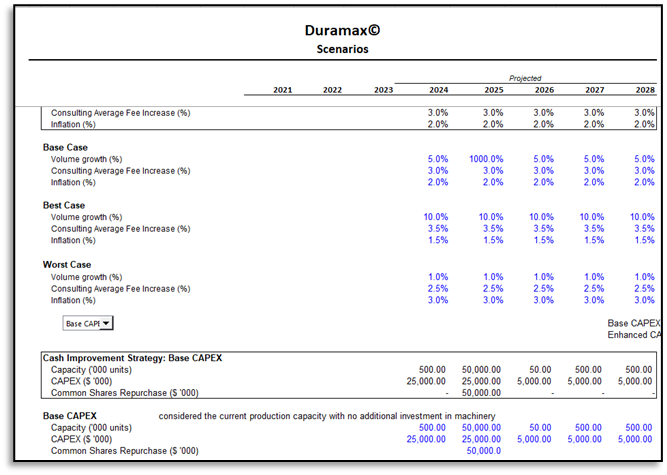
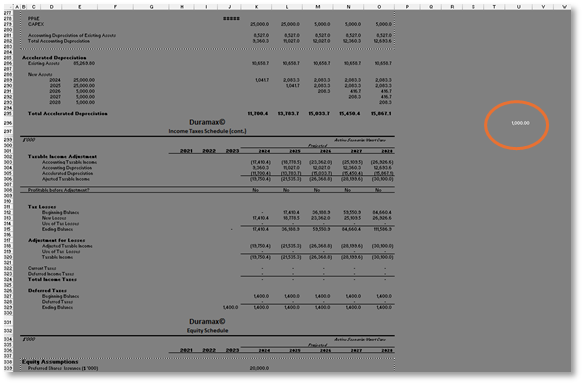
To make sure our formulas are working correctly, let’s put the assumptions to the extreme and check these formulas. We will simulate a huge growth, so our revenue is very high. For that, go to scenarios (which is the first entry of revenue growth in the model) and change growth to 1000% in the second year (yes, it needs to be extreme, the model must be ready for anything). Make sure you also increase capacity to an extreme so that won’t stop your revenue from soaring. In fact, that’s also a good time to stress test the capacity.
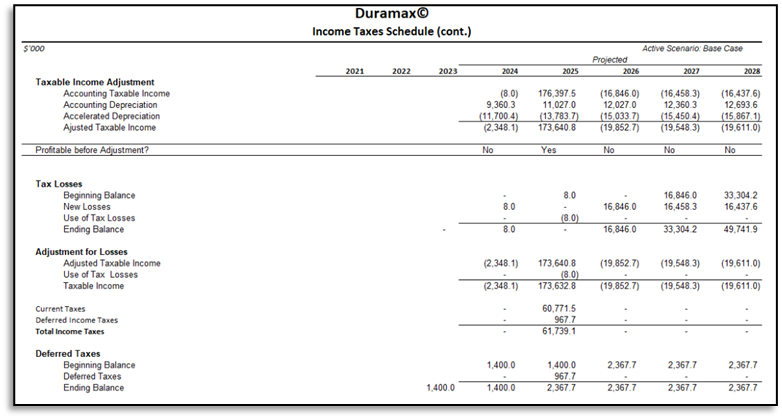
Now you will see that There is a huge profit in the first year and in the next year when we reduced the capacity significantly, we had a loss. With one move, we tested the capacity formulas and the Income Taxes schedule. We see that we still had a loss in the first year, and we accumulated for the next year, and next year when we had profit, we used that loss properly.
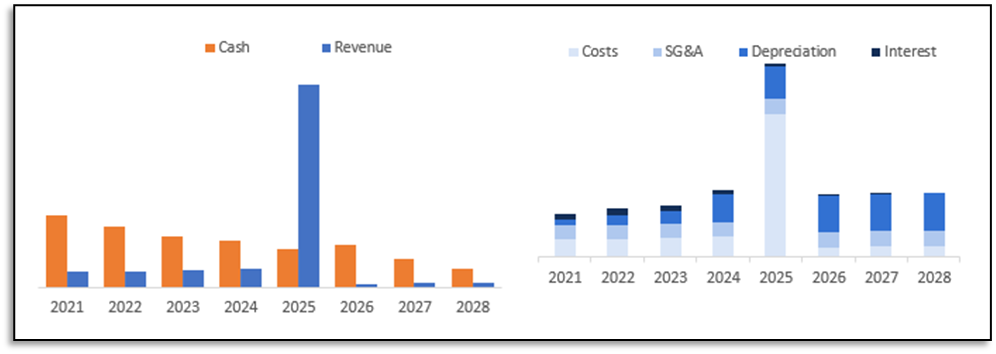
That’s also a good time to test your charts. Do they reflect extreme conditions? Are they flexible to adapt to larger numbers?
You can play with these techniques, making sure to test your formulas and calculations to have a very flexible model.
You can also use this technique to test:
· The revolving Debt – change your cash needs to run out of cash and see if your revolving is working as expected.
· The Depreciation – change the years of depreciation to make sure you don’t over depreciate.
· The debt – change the debt amortization to make sure you don’t over amortize.
· The equity – make your model show a loss to make sure you are showing 0 in Common shares dividends.
Make sure as you are building the model you think of any extreme situation that can happen and if your calculations are ready.
Sanity Check
In the sanity check exercise, you should try to make sense of your calculations. This is a very subjective part of the attempt to perfect your model. I’ll give you a few examples, but the list of things you can test can be infinite.
Checking the Historical Metrics
In the case of Duramax, we see that it has a reasonable trend of Revenue Growth and COGS (% of revenue). We can even note that last year had a lower growth , but we know that we reached capacity so it’s explainable.

Now, Let’s make an error in the Cost calculation (not in the assumptions) that could make this trend go wrong. Assume we completely ignored the split between Variable and Fixed Costs and we just increase the total cost with inflation.
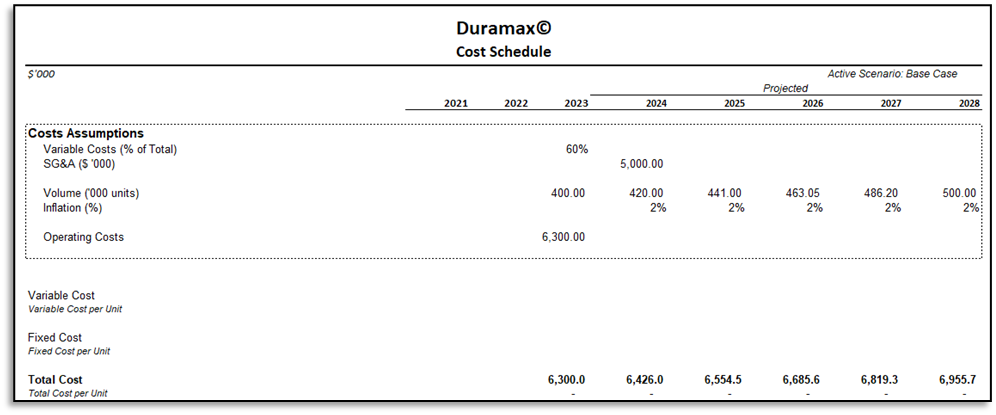
We now can see that our Cogs (% of Revenue) is dropping considerably. That should trigger us to investigate if we are calculating Costs the best way.

I used a simple example here, but you can use your analytical skills to check all the most important metrics for the company and have a sense if the way you are calculating the schedules reflects the way actuals present.
As a test you could also use the assumptions from actuals and check if you arrive to similar amounts in forecast. This would be a longer exercise as often you need to change too many assumptions to arrive at the right result and sometimes it’s not worth the time you will spend.
As you build your model, on every schedule, try to do a quick sanity check by asking why you see fluctuations in some of the metrics. If you can easily find the explanation (i.e. the capacity reach ) then test that explanation with different assumptions to ensure your calculations are well thought out and reflect the logic presented in actuals.